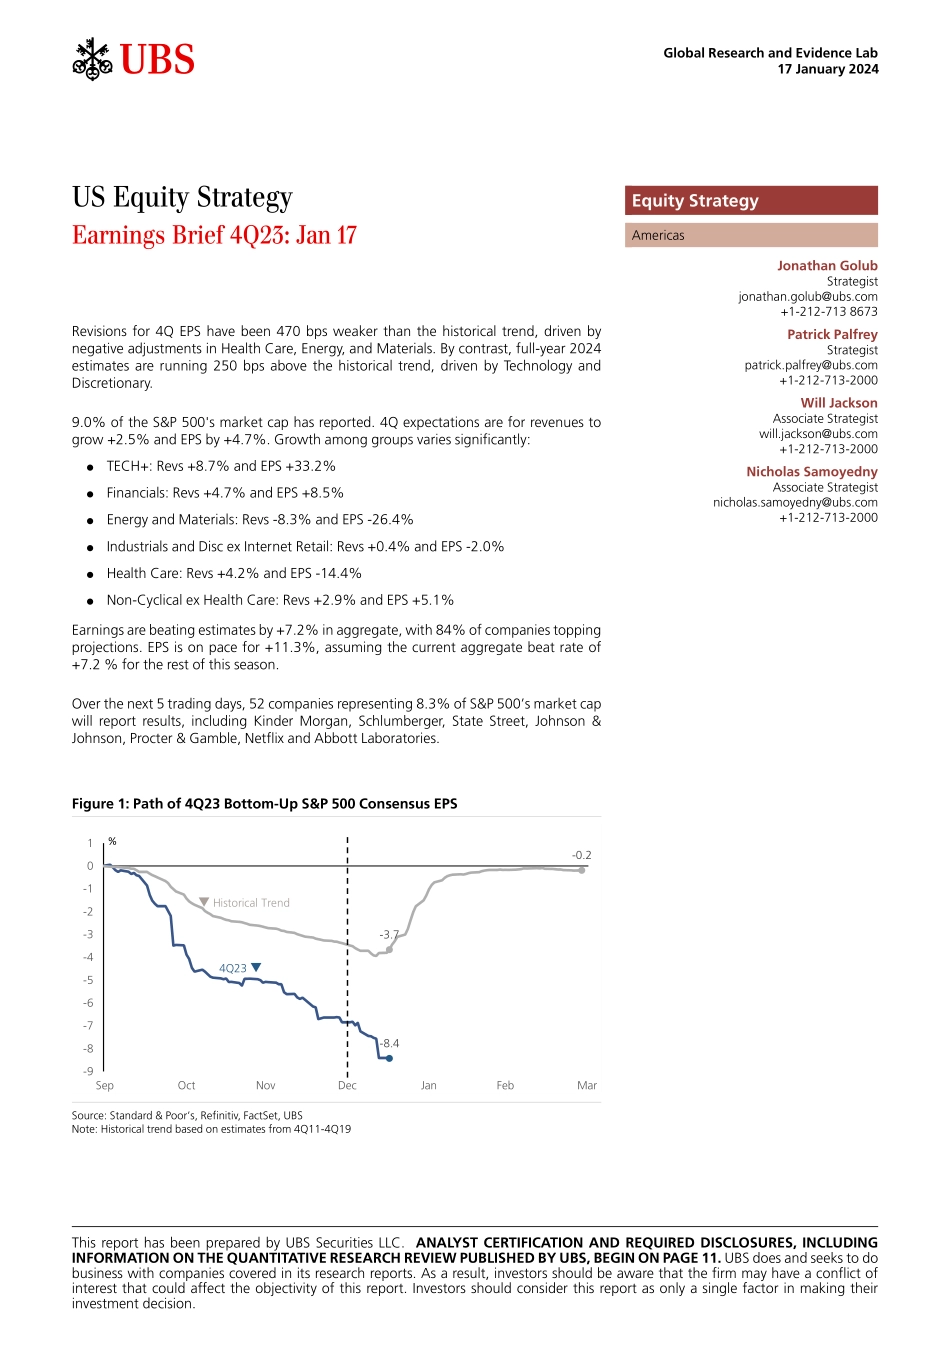
ab17 January 2024Global Research and Evidence LabUS Equity StrategyEarnings Brief 4Q23: Jan 17Revisions for 4Q EPS have been 470 bps weaker than the historical trend, driven by negative adjustments in Health Care, Energy, and Materials. By contrast, full-year 2024 estimates are running 250 bps above the historical trend, driven by Technology and Discretionary. 9.0% of the S&P 500's market cap has reported. 4Q expectations are for revenues to grow +2.5% and EPS by +4.7%. Growth among groups varies significantly:TECH+: Revs +8.7% and EPS +33.2%Financials: Revs +4.7% and EPS +8.5%Energy and Materials: Revs -8.3% and EPS -26.4%Industrials and Disc ex Internet Retail: Revs +0.4% and EPS -2.0%Health Care: Revs +4.2% and EPS -14.4%Non-Cyclical ex Health Care: Revs +2.9% and EPS +5.1%Earnings are beating estimates by +7.2% in aggregate, with 84% of companies topping projections. EPS is on pace for +11.3%, assuming the current aggregate beat rate of +7.2 % for the rest of this season.Over the next 5 trading days, 52 companies representing 8.3% of S&P 500’s market cap will report results, including Kinder Morgan, Schlumberger, State Street, Johnson & Johnson, Procter & Gamble, Netflix and Abbott Laboratories.Figure 1: Path of 4Q23 Bottom-Up S&P 500 Consensus EPS-3.7-0.2-8.4-9-8-7-6-5-4-3-2-101SepOctNovDecJanFebMarq Historical Trend4Q23 q%Source: Standard & Poor’s, Refinitiv, FactSet, UBSNote: Historical trend based on estimates from 4Q11-4Q19This report has been prepared by UBS Securities LLC. ANALYST CERTIFICATION AND REQUIRED DISCLOSURES, including information on the Quantitative Research Review published by UBS, begin on page 11. UBS does and seeks to do business with companies covered in its research reports. As a result, investors should be aware that the firm may have a conflict of interest that could affect the objectivity of this report. Investors should consider this report as only a single factor in making their investment decision.Equity StrategyAmericasJonathan GolubStrategist jonathan.golub@ubs.com +1-212-713 8673Patrick PalfreyStrategist patrick.palfrey@ubs.com +1-212-713-2000Will JacksonAssociate Strategist will.jackson@ubs.com +1-212-713-2000Nicholas SamoyednyAssociate Strategist nicholas.samoyedny@ubs.com +1-212-713-2000 US Equity Strategy 17 January 2024ab 2US Equity StrategyUBS ResearchS&P 500 Figure 2: 4Q23 Earnings Dashboard – S&P 500Weighted Growth YoY (%)RevenueMarginsEarningsBuybacksEPSS&P 5002.50.73.21.54.7Cyclicals-3.0-12.4-15.42.1-13.3Energy-9.1-21.4-30.52.9-27.6Materials-5.8-17.1-22.90.7-22.2Industrials1.4-3.9-2.51.4-1.2Discretionary ex-Internet Retail-0.7-4.3-5.01.7-3.3TECH+8.722.931.61.633.2Technology6.29.715.90.916.8Internet Retail11.2297.0308.2N.A.334.9Media & Internet14.184.898.92.9101.8Non-Cyclicals3.5-8.6-5.10.6-4.5Staples2.9-0.72.20.22.4Health Care4.2-20.1-15.81.4-14.4Utilities7.911.319.2-2.816.4REITs6.6-3.92.7-3.3-0.6Telecos-1.1-4.5-5.50.8-4.7Financials4.71.96.61.98.5Source: Standard & Poor’s, ...