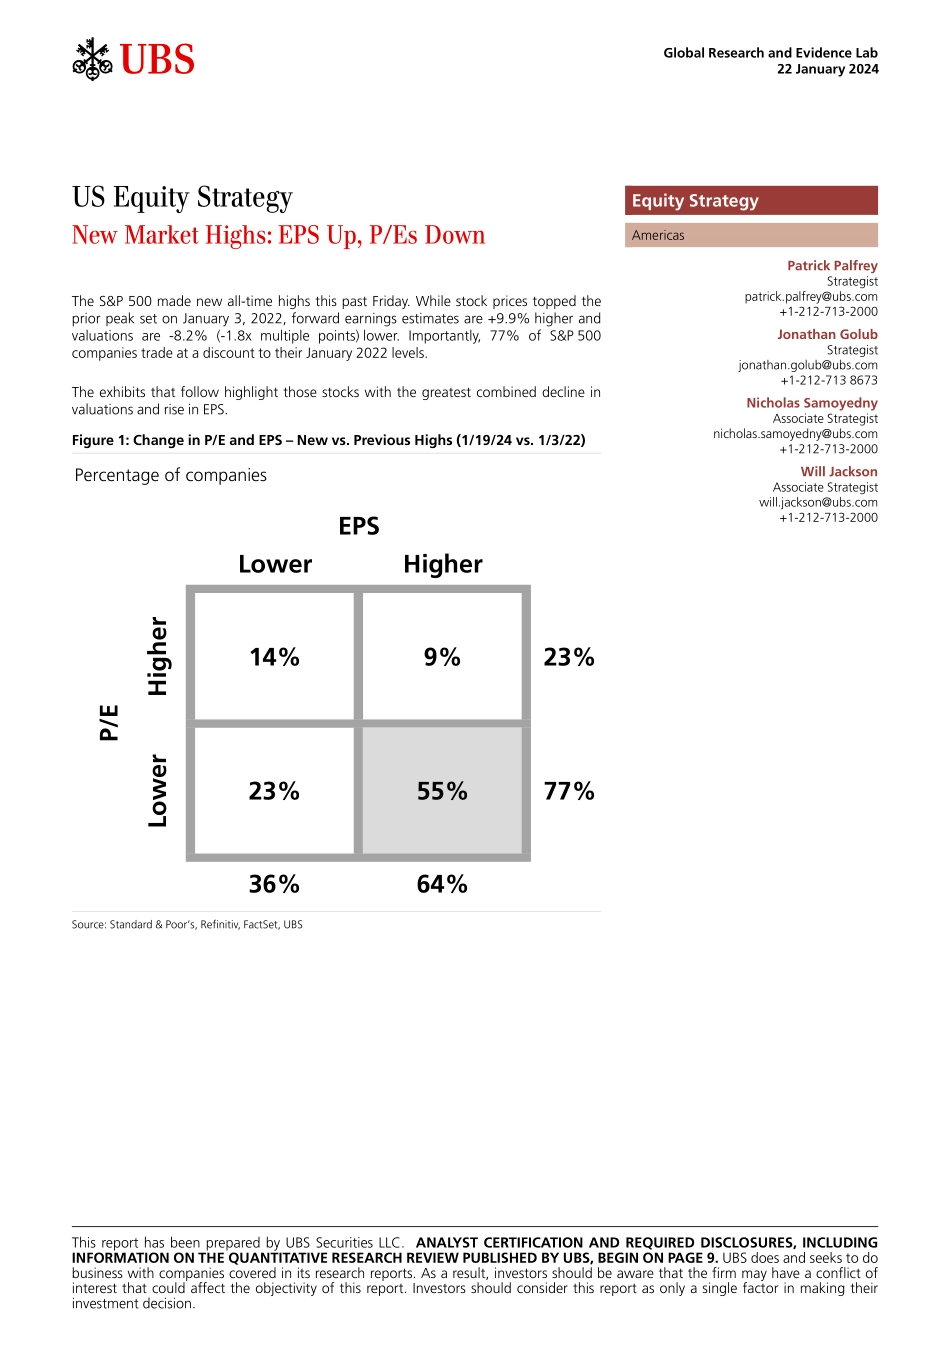
ab22 January 2024Global Research and Evidence LabUS Equity StrategyNew Market Highs: EPS Up, P/Es DownThe S&P 500 made new all-time highs this past Friday. While stock prices topped the prior peak set on January 3, 2022, forward earnings estimates are +9.9% higher and valuations are -8.2% (-1.8x multiple points) lower. Importantly, 77% of S&P 500 companies trade at a discount to their January 2022 levels.The exhibits that follow highlight those stocks with the greatest combined decline in valuations and rise in EPS.Figure 1: Change in P/E and EPS – New vs. Previous Highs (1/19/24 vs. 1/3/22)Percentage of companiesLowerHigherHigher14%9%23%Lower23%55%77%36%64%P/EEPSSource: Standard & Poor’s, Refinitiv, FactSet, UBSThis report has been prepared by UBS Securities LLC. ANALYST CERTIFICATION AND REQUIRED DISCLOSURES, including information on the Quantitative Research Review published by UBS, begin on page 9. UBS does and seeks to do business with companies covered in its research reports. As a result, investors should be aware that the firm may have a conflict of interest that could affect the objectivity of this report. Investors should consider this report as only a single factor in making their investment decision.Equity StrategyAmericasPatrick PalfreyStrategist patrick.palfrey@ubs.com +1-212-713-2000Jonathan GolubStrategist jonathan.golub@ubs.com +1-212-713 8673Nicholas SamoyednyAssociate Strategist nicholas.samoyedny@ubs.com +1-212-713-2000Will JacksonAssociate Strategist will.jackson@ubs.com +1-212-713-2000 US Equity Strategy 22 January 2024ab 2US Equity StrategyUBS ResearchS&P 500Figure 2: Change in P/E and EPS – New vs. Previous Highs (1/19/24 vs. 1/3/22)Percentage of companiesTECH+CyclicalsLowerHigherLowerHigherHigher18%6%24%Higher18%13%31%Lower18%58%76%Lower17%51%69%37%63%35%65%Non-CyclicalsFinancialsLowerHigherLowerHigherHigher9%8%16%Higher10%4%15%Lower26%58%84%Lower34%51%85%34%66%44%56%EPSP/EEPSP/EEPSP/EEPSP/ESource: Standard & Poor’s,Refinitiv, FactSet, UBSUS Equity Strategy 22 January 2024ab 3Figure 3: S&P 500 Price3500400045005000Jun 21Dec 21Jun 22Dec 22Jun 23Dec 231/3/22Current10/12/22Price= P/E xEPSPrior Peak4,797 = 21.5 x$223Trough3,577 = 15.2 x$236-25.4%-6.3x5.8%(-29.5%)Trough3,577 = 15.2 x$236Current4,840 = 19.8 x$24535.3%4.6x3.9%(30.3%)Prior Peak4,797 = 21.5 x$223Current4,840 = 19.8 x$2450.9%-1.8x9.9%(-8.2%)Source: Standard & Poor’s, FactSet, UBSUS Equity Strategy 22 January 2024ab 4Figure 4: Change in P/E and EPS – New vs. Previous Highs (1/19/24 vs. 1/3/22)% ChangeTickerNameSectorP/EEPSCombination1 CDAYCeridianInd-84.9330.6415.62 NVDANVIDIATech-50.2289.8340.03 TMUST-Mobile USComm-50.8174.5225.34 LYVLive Nation EntertainmentComm-67.7153.3221.05 LWLamb Weston HoldingsStap-37.6172.3209.96 ALBAlbemarleMat-75.196.5171.57 MPCMarathon PetroleumEne-35.2133.9169.18 DXCMDexComH.C.-48.9110.7159.79 CRMSalesforceTech-46.099.5145.510 HALHalliburtonEne-29.6102.4131.911 EGEverest GroupFin-25.6101.2126.812 VLOValero EnergyEne-28.197.6125.613 FTNTFortinet...