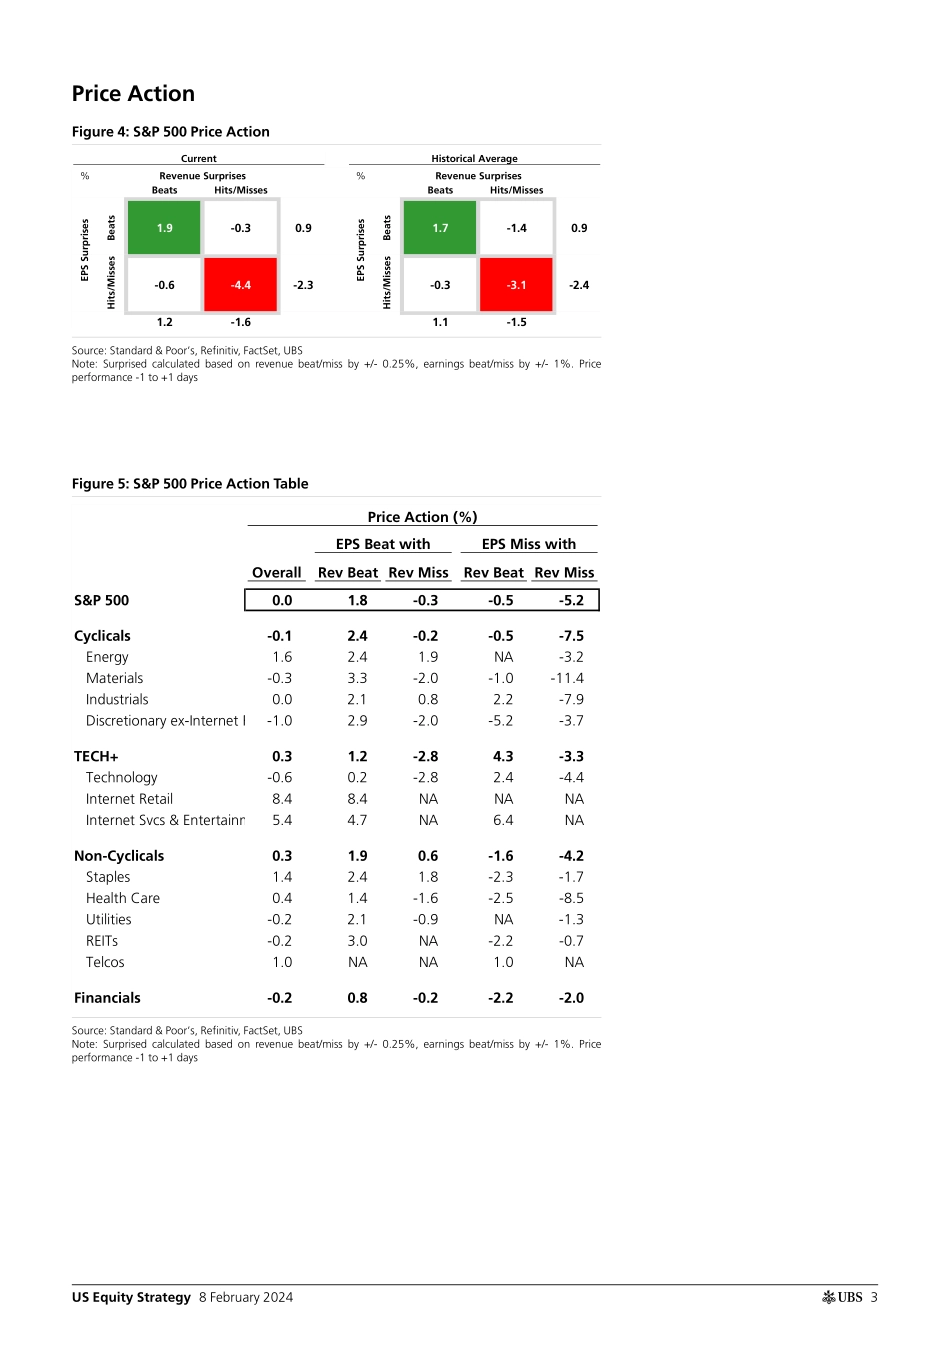
ab8 February 2024Global Research and Evidence LabUS Equity StrategyEarnings Brief 4Q23: Feb 08The dispersion in recent results has been particularly large. While 4Q revisions are much worse than the long-term trend, 2024 is much stronger.74.2% of the S&P 500's market cap has reported. 4Q expectations are for revenues to grow 3.5% and EPS by 9.0%. Growth among groups varies significantly. The table below blends reported results with consensus estimates for unreported companies:GroupEPS Growth (%)TECH+39.8Financials10.6Non-Cyclical ex Health Care 6.7Industrials & Disc ex Internet Retail3.8Health Care-10.7Energy & Materials-22.1Earnings are beating estimates by 7.3% in aggregate, with 72% of companies topping projections. EPS is on pace for 10.9%, assuming the current aggregate beat rate of 7.3% for the rest of this season.Firms beating on both revenues and EPS are outperforming the market by 1.9% vs. an average of 1.7%, while ones missing on both are underperforming by -4.4% vs. -3.1%.Over the next 5 trading days, 62 companies representing 6.6% of S&P 500’s market cap will report results, including Pepsi, Coca-Cola, Airbnb, Marriott International, Cisco Systems, Kraft Heinz, and Deere. Figure 1: Path of 1Q24 Bottom-Up S&P 500 Consensus EPS-1.5-2.0-0.2-4.5-4.0-3.5-3.0-2.5-2.0-1.5-1.0-0.50.0DecJanFebMarAprMay Historical Trend1Q24 Source: Standard & Poor’s, Refinitiv, FactSet, UBS Note: Historical trend based on estimates from 1Q11-4Q19This report has been prepared by UBS Securities LLC. ANALYST CERTIFICATION AND REQUIRED DISCLOSURES, including information on the Quantitative Research Review published by UBS, begin on page 13. UBS does and seeks to do business with companies covered in its research reports. As a result, investors should be aware that the firm may have a conflict of interest that could affect the objectivity of this report. Investors should consider this report as only a single factor in making their investment decision.Equity StrategyAmericasJonathan GolubStrategist jonathan.golub@ubs.com +1-212-713 8673Patrick PalfreyStrategist patrick.palfrey@ubs.com +1-212-713-2000Will JacksonAssociate Strategist will.jackson@ubs.com +1-212-713-2000Nicholas SamoyednyAssociate Strategist nicholas.samoyedny@ubs.com +1-212-713-2000 US Equity Strategy 8 February 2024ab 2US Equity StrategyUBS ResearchS&P 500 Figure 2: 4Q23 Earnings Dashboard – S&P 500Weighted Growth YoY (%)RevenueMarginsEarningsBuybacksEPSS&P 5003.53.87.41.69.0Cyclicals-2.0-8.4-10.42.2-8.2Energy-9.8-15.9-25.73.1-22.6Materials-5.9-15.2-21.00.7-20.3Industrials2.82.25.01.56.5Discretionary ex-Internet Retail1.7-3.6-1.91.7-0.2TECH+10.128.138.21.739.8Technology7.013.220.20.921.1Internet Retail13.6374.9388.5N.A.420.5Media & Internet16.293.1109.33.0112.3Non-Cyclicals4.7-7.2-2.50.6-1.8Staples2.62.34.90.25.1Health Care7.0-19.1-12.21.4-10.7Utilities5.014.119.1-2.816.3REITs6.3-3.52.8-3.3-0.5Telecos0.9-8.8-7.90.8-7.2Financials5.03.68.62.010.6Source: Standard & Poor’s, Refinitiv, FactSet, ...