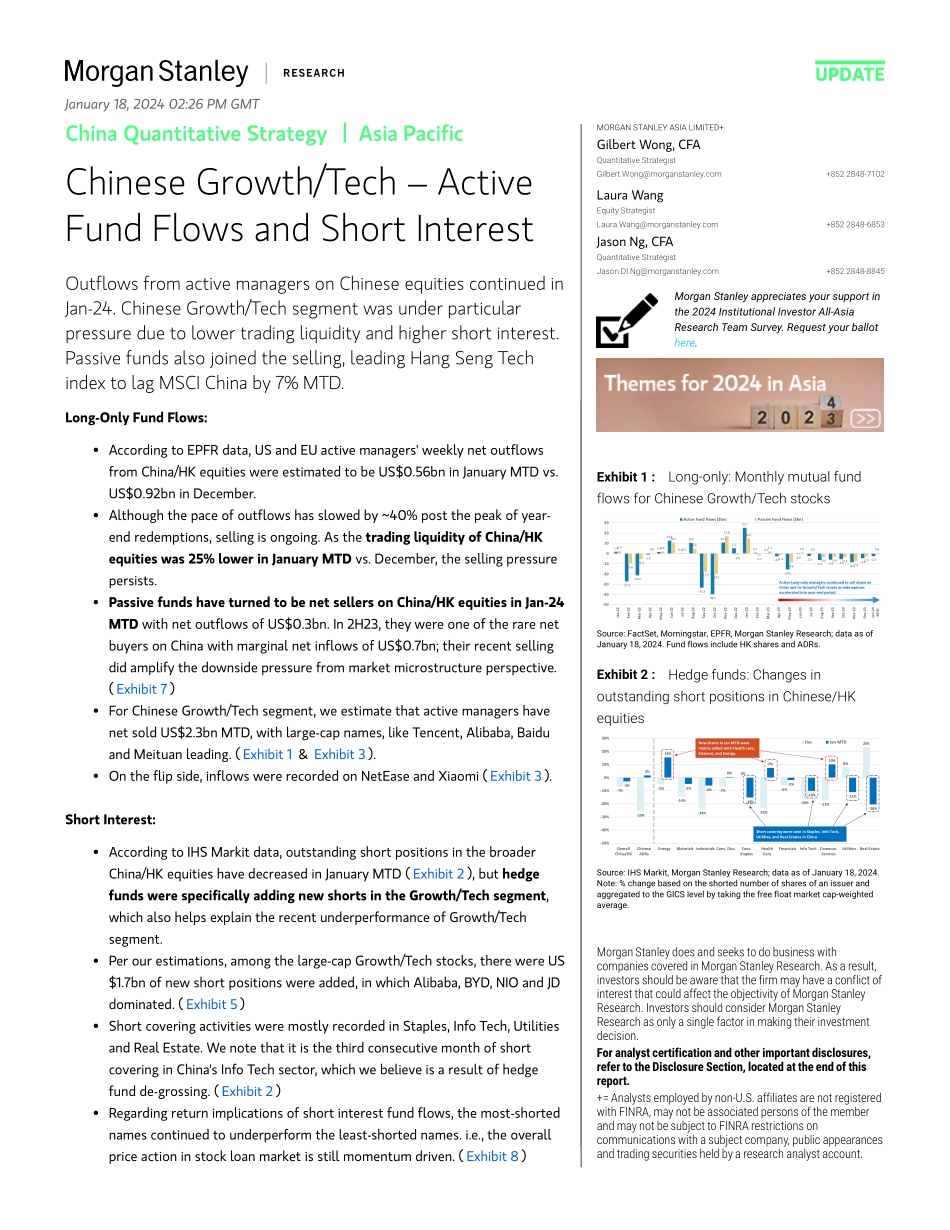
M UpdateChina Quantitative Strategy | Asia PacificChinese Growth/Tech – Active Fund Flows and Short InterestMorgan Stanley Asia Limited+Gilbert Wong, CFAQuantitative Strategist Gilbert.Wong@morganstanley.com +852 2848-7102 Laura WangEquity Strategist Laura.Wang@morganstanley.com +852 2848-6853 Jason Ng, CFAQuantitative Strategist Jason.Dl.Ng@morganstanley.com +852 2848-8845 Morgan Stanley appreciates your support in the 2024 Institutional Investor All-Asia Research Team Survey. Request your ballot here. Exhibit 1 : Long-only: Monthly mutual fund flows for Chinese Growth/Tech stocks1.8-27.2-21.3-1.01.412.60.210.4-33.3-39.710.75.125.10.70.1-2.7-15.5-0.5-2.3-6.2-5.9-5.5-8.4-4.5-2.32.4-9.6-5.40.62.010.70.34.6-17.7-19.717.0-0.914.5-1.72.2-1.4-8.61.00.4-3.4-3.0-3.5-7.4-2.90.6-50-40-30-20-100102030Jan-22Feb-22Mar-22Apr-22May-22Jun-22Jul-22Aug-22Sep-22Oct-22Nov-22Dec-22Jan-23Feb-23Mar-23Apr-23May-23Jun-23Jul-23Aug-23Sep-23Oct-23Nov-23Dec-23Jan-24MTDActive Fund Flows ($bn)Passive Fund Flows ($bn)Active Long-only managers continued to sell down on China and its Growth/Tech stocks as redemptions accelerated into year-end period. Source: FactSet, Morningstar, EPFR, Morgan Stanley Research; data as of January 18, 2024. Fund flows include HK shares and ADRs. Exhibit 2 : Hedge funds: Changes in outstanding short positions in Chinese/HK equities-7%-25%-5%-14%-24%-7%0%-23%-6%-16%-17%8%23%-3%2%15%-5%-6%0%-15%7%-2%-10%10%-11%-20%-50%-40%-30%-20%-10%0%10%20%30%OverallChina/HKChineseADRsEnergyMaterials Industrials Cons. Disc.Cons.StaplesHealthCareFinancialsInfo TechCommun.ServicesUtilitiesReal EstateDecJan MTDShort covering were seen in Staples, Info Tech, Utilities, and Real Estates in China.New shorts in Jan MTD were mainly added onto Health care, Internet, and Energy. Source: IHS Markit, Morgan Stanley Research; data as of January 18, 2024. Note: % change based on the shorted number of shares of an issuer and aggregated to the GICS level by taking the free float market cap-weighted average.Outflows from active managers on Chinese equities continued in Jan-24. Chinese Growth/Tech segment was under particular pressure due to lower trading liquidity and higher short interest. Passive funds also joined the selling, leading Hang Seng Tech index to lag MSCI China by 7% MTD. Long-Only Fund Flows: • According to EPFR data, US and EU active managers' weekly net outflows from China/HK equities were estimated to be US$0.56bn in January MTD vs. US$0.92bn in December. • Although the pace of outflows has slowed by ~40% post the peak of year-end redemptions, selling is ongoing. As the trading liquidity of China/HK equities was 25% lower in January MTD vs. December, the selling pressure persists.• Passive funds have turned to be net sellers on China/HK equities in Jan-24 MTD with net outflows of US$0.3bn. In 2H23, they were one of the rare net buyers on China with marginal net inflows of US$0.7bn; their recent selling did amplify the downside pressure fr...